Dot 画图常用语法
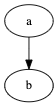
有向图
digraph {
    a -> b
}
无向图
graph {
    a -- b
}

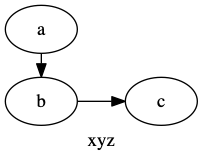
图属性
label="My Graph"给图添加标题。rankdir=LR默认图为上下布局,修改为左右布局。{rank=same; a, b, c }将 a, b, c 画到同一个层级上
digraph {
    label="xyz"
    rankdir=LR
    {rank=same; a, b}

    a -> b
    b -> c
}
节点属性
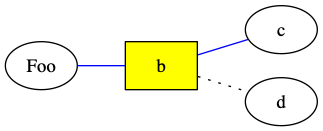
边属性
label="XXX"给边添加说明信息color=red修改边 颜色penwidth=2.0修改边宽度style=dotted修改边的样式
graph {
    rankdir=LR

    a [label="Foo"]
    b [shape=box, style=filled, fillcolor=yellow]
    a -- b -- c [color=blue]
    b -- d [style=dotted]
}
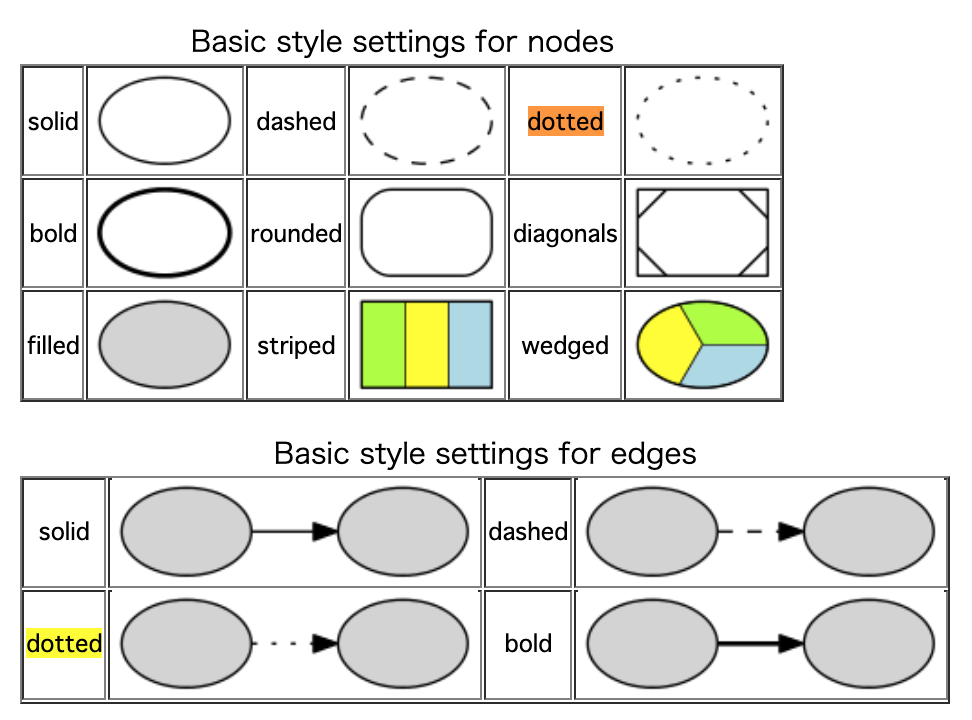
常见的节点和边样式属性:
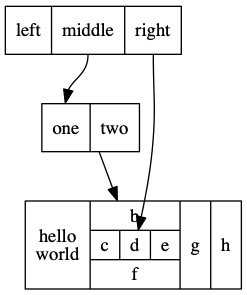
Record 节点
digraph structs {
    node [shape=record];

    struct1 [shape=record,label="<f0> left|<f1> middle|<f2> right"];
    struct2 [shape=record,label="<f0> one|<f1> two"];
    struct3 [shape=record,label="hello\nworld |{ b |{c|<here> d|e}| f}| g | h"];

    struct1:f1 -> struct2:f0;
    struct1:f2 -> struct3:here;
    struct2 -> struct3
}
命令行参数
将图源码保存为 input.dot 文件,执行以下命令生成 png 图:
$ dot -Tpng -o output.png input.dot